Codicote Neighbourhood Plan 2024 - 2031 Submission
3 Parish Portrait View responses
3.1 A Short History of Codicote
3.1.1 Situated at the southernmost tip of the district of North Hertfordshire, the parish of Codicote covers an area of 530 hectares and has a population of around 3500. The parish encompasses the village known as Codicote and several outlying hamlets: Drivers End, Nup End, Hogsnorton, Rabley Heath and Potters Heath. The village of Codicote provides facilities for surrounding smaller villages.
3.1.2 The settlement of Codicote, as we know it, dates to the mid thirteenth century and almost certainly came into being due to the king granting to the lord of the manor the right to hold a market in the parish. There would have been permanent buildings around the market place, and it is likely that these were laid out in the usual format for a market settlement - dwellings built close to the road with long narrow strips to the rear, housing a yard, outbuildings and often a small pasture. According to the Domesday Book there were two corn mills and about 100 inhabitants in 1086. St Giles Church built in about 1110. By the late 1200's there were several permanent shops and at least one tavern. The village expanded north and south, creating the High Street; this was an important highway linking Hatfield, Welwyn and Hitchin. In the 18th century it became a turnpike road and was much upgraded. For short periods there would have been a tollhouse and weighing house in or near the parish.
3.1.3 Early expansion to the west created St Albans Road. Following the Black Death in 1349 and the collapse of the market in early Tudor times, gaps appeared in the street frontages, not to be filled in again until the 19th century. The earliest houses surviving today in the village and hamlets date from about 1600.
3.1.4 In the mid 19th century, a road was created running parallel to the lower part of the High Street to provide accommodation for the increasing population; originally known as 'New Street', we now know this road as 'Newtown'. The terraced houses sited here are amongst the earliest in the village; later in the 19th century further terraces were built at the southern end of the village.
3.1.5 Large estates/farms within the Parish include: The Node (to the north) built in 1811 which originally included the Model Dairy (around 1938) which is mentioned in Pevsner's (now Node Court). The Bury (Bury Farm in the 1700's and 1800's the largest farm in Codicote) with over 398 acres.
3.1.6 As the population migrated to the larger towns during the Industrial Revolution, the growth of the village slowed. A development of council houses was built after the First World War at the north end of the High Street in the 'White City', now known as Tower Road; a few private bungalows were built at the end of St Albans Road.
3.1.7 After the Second World War and through the 1960's and 70's growth accelerated with the creation of the areas around Hill Road and Meadow Way; The Elms, The Chestnuts and Bury Lane; Valley Road and The Birches.
3.1.8 Since then, the designation of the Green Belt around the village had meant that the boundary had remained essentially unchanged and further development had been limited to infilling. The adoption of the North Hertfordshire Local Plan 2011-2031, in November 2022, allocating four housing development sites in the Green Belt on the edge of the village, is going to change the shape and size of the village significantly. Further details are provided in the introductions to each section of the Neighbourhood Plan.
3.2 Demographic Profile of Codicote Parish
3.2.1 The demographic data for the parish based on the 2021 Census is detailed below. Where appropriate, comparative data for North Hertfordshire District and Hertfordshire County are provided as evidence to support the policies in the Neighbourhood Plan.
Indicators of Housing Need
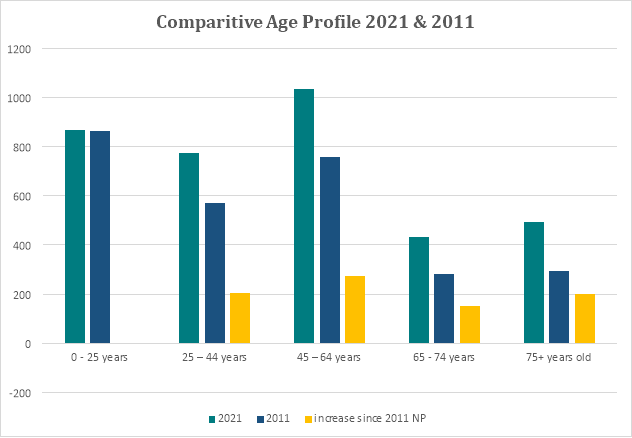
3.2.2 The table and chart below show the age profile of the parish in 2021 compared to 2011 the population and both the numerical and the % increase in the population in the age range 24-75+.
3.2.3 The age structure of the population is a key indicator of the future need for housing. Whilst there has not been a local Housing Need Assessment conducted to project demand in future years, we do know from the detailed age breakdown in census, that in 2021, 33% of the local population was over 60 years, and 26% over 65 years.

|
Age range |
2011 ONS |
2021 ONS |
Increase |
% Increase |
|
25-44 |
571 |
774 |
203 |
35.6% |
|
45-64 |
758 |
1033 |
275 |
36.3% |
|
65-74 |
282 |
432 |
150 |
53.2% |
|
75+ |
294 |
493 |
199 |
67.7% |
Figure 3: Age Profile Comparison 2011 & 2021
3.2.4 Of the 25 years plus age groups, there has been an increase in actual numbers across all groups, and notably in the 65-84 age band, 349 people, or 42% of that increase. Ageing will be a major driver of housing need going forward. Unless a local housing needs assessment is conducted, we do not know if older households intend to occupy the same dwellings they currently live in or move within the community to a home better suited to the size of their household or evolving needs.
3.2.5 The current injection of small and mid-sized homes could improve the offering for younger households who have few options for their next step on the property ladder and enable older households currently under-occupying larger homes to downsize, and in so doing potentially create churn in the market. It is also acknowledged that local properties may be too expensive to be taken up by many, especially young local households (North Herts Housing Strategy 2019-24 suggests earnings have not kept pace with housing prices, such that homes in the district cost nine times that of earnings).

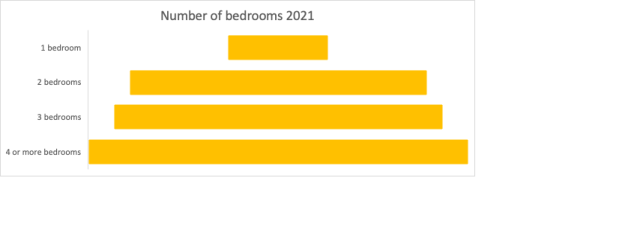
Figure 4: Distribution of Homes in the Parish by Number of Bedrooms in 2021.
[Note: percentages and numbers for the distribution of homes in the Parish are: 1 bed 137 (9%), 2 bed 404 (27%), 3 bed 446 (30%), 4+ bed 515 (34%)]
Impact of Increased Numbers of Cars in the Village
3.2.6 Several issues arising from increased numbers of cars in the village have been identified in the Vision and Objectives. Reference is made to Objectives 2, 8, and 9 as follows:
No.
Objective
2
To ensure realistic numbers of formally designated parking places for residents and visitors are provided within each new development.
8
To alleviate the existing parking problem in the village, especially the High Street and feeder roads, and the impact on pedestrian safety, disabled access and traffic congestion.
9
To minimise the impact of traffic generated by new developments on air quality, congestion, delays and safety within the village, especially the High Street and at key junctions, prevent cut-throughs on country lanes and misuse by HGV’s.
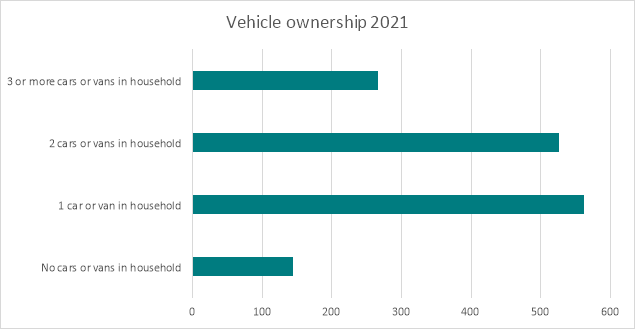
3.2.7 The following chart and tables show vehicle ownership numbers with an estimation of the increase in vehicle numbers that will result as the allocated 350 new homes are built, using the % split of vehicle ownership across the new households.

|
# vehicles in household 2021 |
% of 1500 households 2021 |
# of households 2021 |
Minimum number of vehicles 2021 |
|
0 |
9.6 |
144 |
0 |
|
1 |
37.5 |
562 |
562 |
|
2 |
35.1 |
526 |
1052 |
|
3+ |
17.8 |
267 |
801 |
|
Total vehicles |
- |
- |
2415 |
|
# vehicles in household |
% split of additional 350 households |
# split of additional 350 households |
Minimum number of additional vehicles |
|
0 |
9.6 |
33 |
0 |
|
1 |
37.5 |
131 |
131 |
|
2 |
35.1 |
122 |
244 |
|
3+ |
17.8 |
62 |
124 |
|
Total Projected Vehicles |
- |
- |
499 |
Figure 5: Vehicle Ownership Numbers and Projected Numbers
3.2.8 In summary, the number of vehicles identified in the 2021 census (2415 vehicles) could potentially increase by 499 vehicles across the 350 new households. The importance of addressing Objectives 2, 8 and 9 is highlighted by the likelihood of approximately 500 additional cars in the village over the next 5 years.
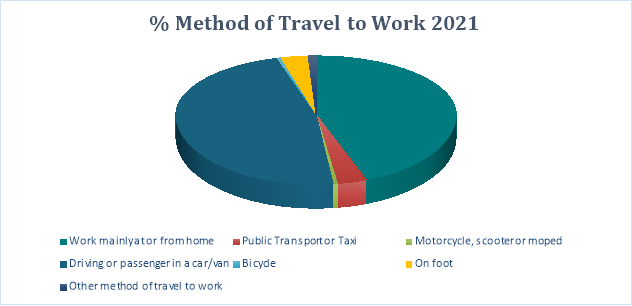
3.2.9 The chart below shows method of travel to work in 2021. The census was conducted during a time when workers were being encouraged to work from home to reduce the spread of Covid 19. Even at this time the most popular method of travel to work was by car or van. Despite efforts to encourage the use of active sustainable travel models, the lack of public transport in the village and narrow, busy roads which are not conducive for cycling, makes the method of travel to work by car/van likely to increase in popularity again rather than decrease.

Figure 6: Method of Travel to Work 2021
3.2.10 A mix of initiatives will be needed to reduce the impact of increased number of vehicles in the village, combined with effective active travel initiatives.
Summary
3.2.11 These statistics are provided to demonstrate how planning applications for new homes should consider the specific profile of Codicote when choosing the size of new homes, location for new homes, the impact additional vehicles will have on the village and wider parish, and how these can be mitigated through S106/CIL contributions, and how active sustainable travel initiatives can be realistic and appeal to new occupiers.
